

Gantt Charts for grants and cases
If you're using CiviCRM for grant management or case management, you migh appreciate this new extension:
CiviGantt — Gantt Charts for CiviGrant and CiviCase.
Here’s a screenshot:
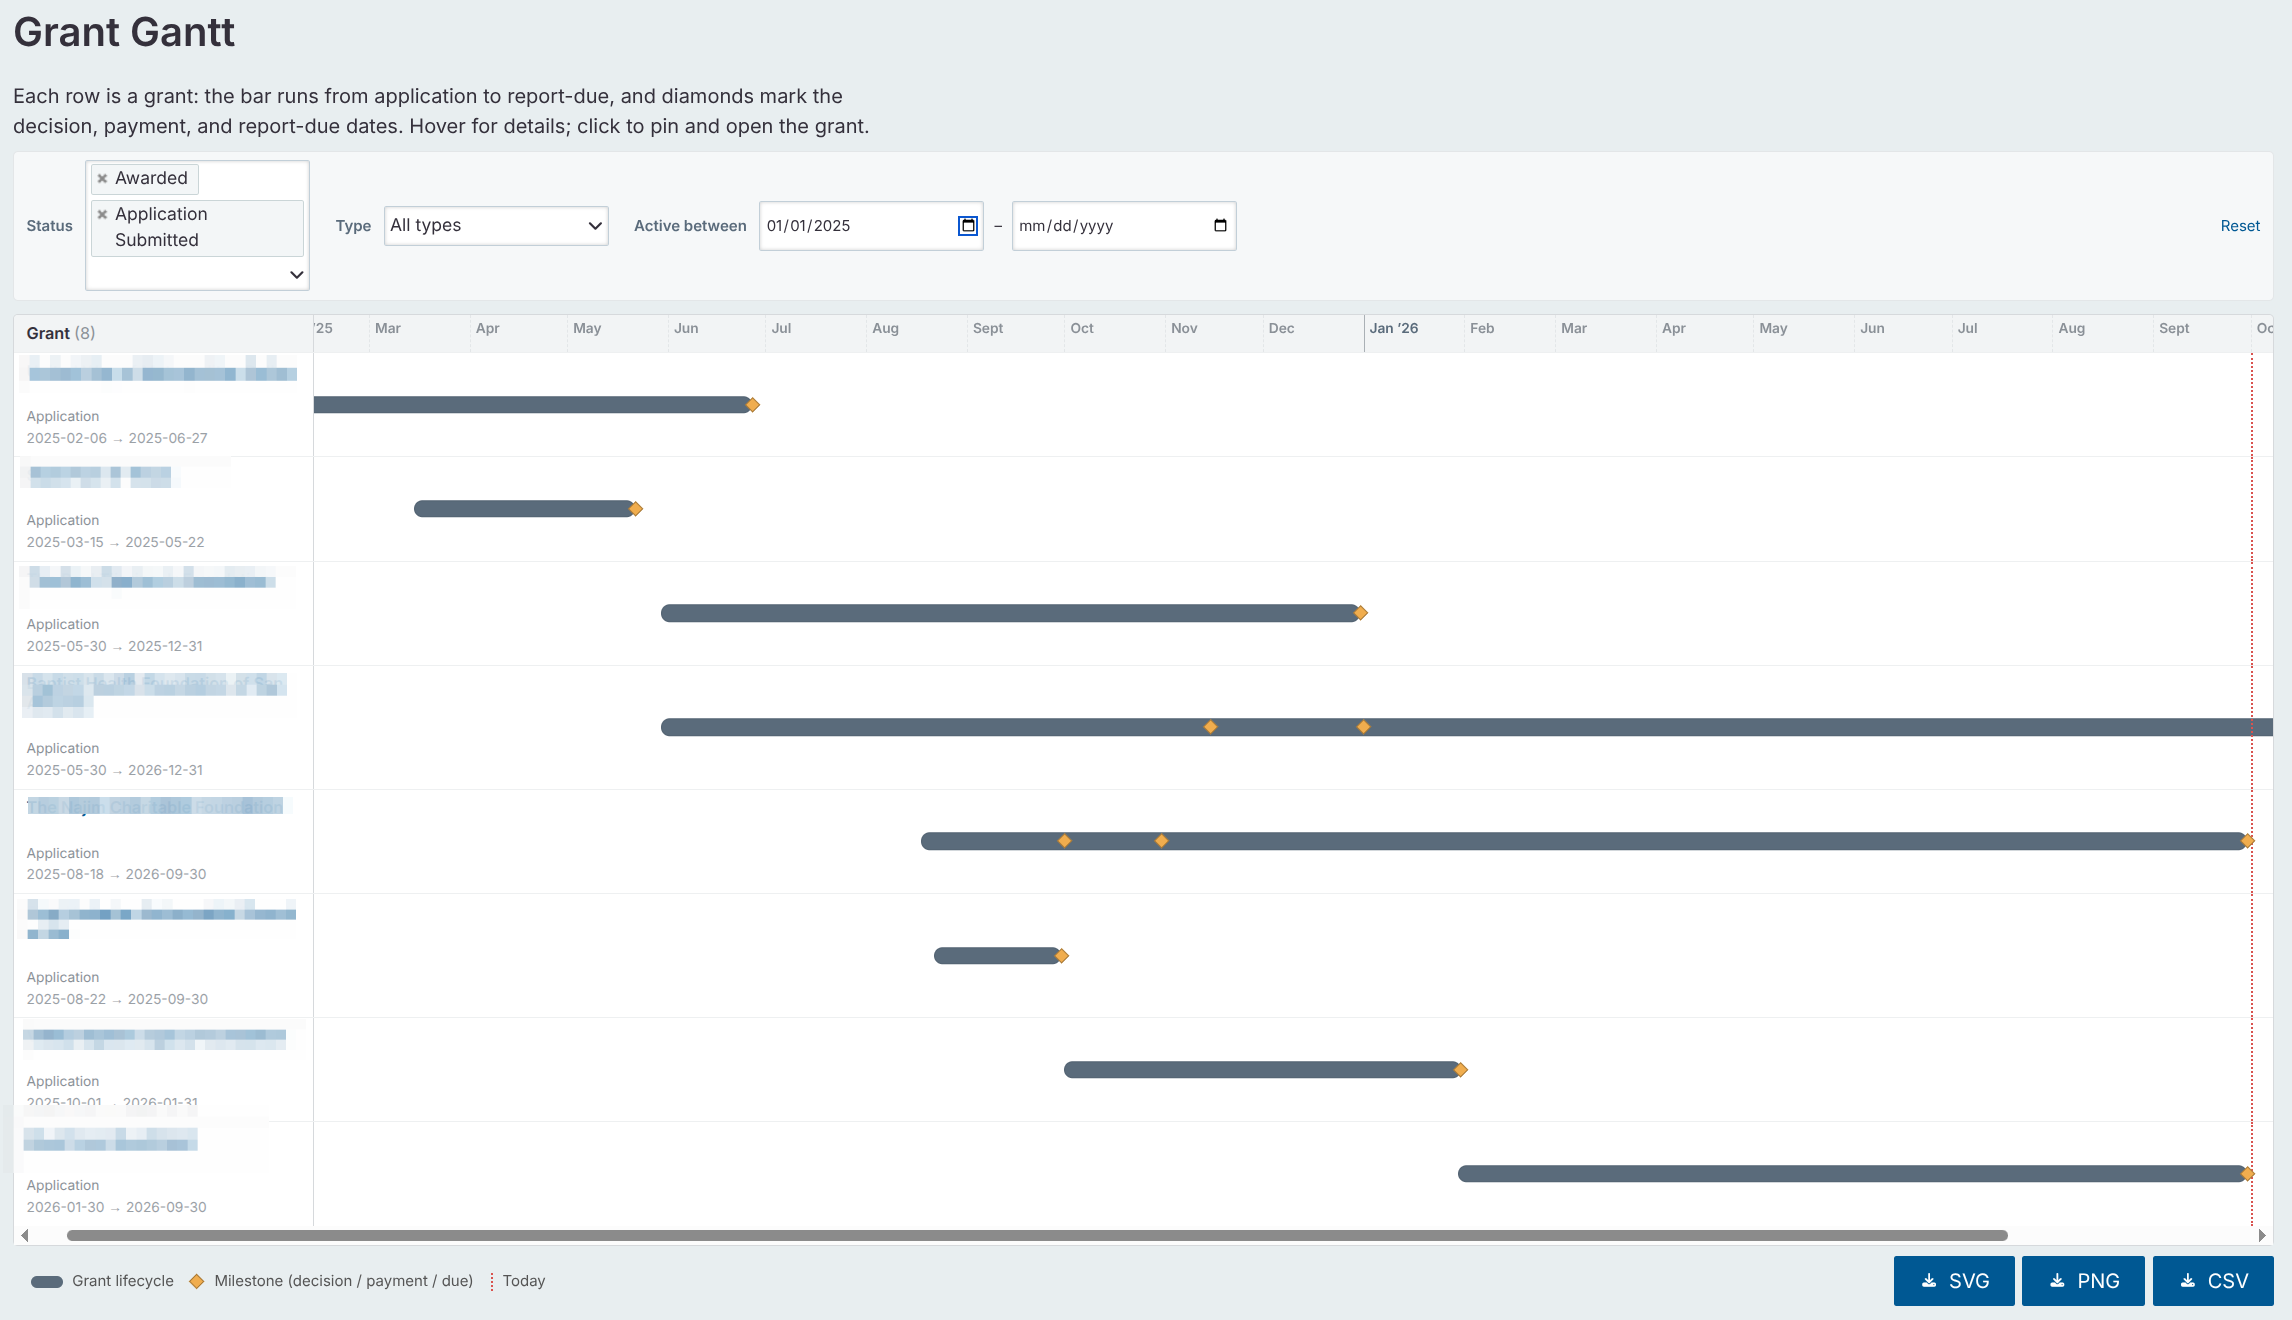
As the extension author Lauren explains:
Almost every question I get asked about Cases and Grants turns out to be a question about time. Which of these have been open longest? What's overlapping? What's due next, and how much of it lands in the same month?
CiviCRM knows all of this. Cases have start dates and end dates, grants have decision and due dates, activities have dates on them — the data is sitting right there. But every built-in way to look at it is a list or a table, and a table is a bad instrument for "when." You can sort a column by end date and still not see that four of the six items finish in the same fortnight.
Sure, you can export data to Excel and build charts there. Doing it once is fine. But doing it every time is painful. Says Lauren:
What I wanted was to have these Case and Grant charts inside CiviCRM, drawing on the live records, respecting the same permissions as everything else, so the person looking at it sees exactly the cases they'd see anywhere else in the system. That's what CiviGantt is.
You can install CiviGantt right from within CiviCRM, through the Extensions management page.
Give it a try. If you like it, send a thank-you to the developer @Lauren, over at the project's main page: https://lab.civicrm.org/extensions/CiviGantt
All the best,
A.